- Libreria
- >
- Libri in lingua
- >
- Matematica e scienze
- >
- Probabilità e statistica
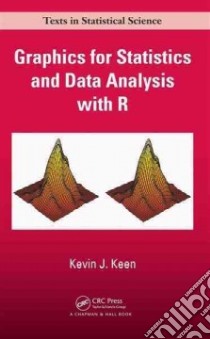
Graphics for Statistics and Data Analysis with R - 9781584880875
Un libro in lingua di Keen Kevin J. edito da Chapman & Hall, 2010
- € 89.00
- Il prezzo è variabile in funzione del cambio della valuta d’origine
The advances of book history and editorial theory remind us that it is vital to look behind the text we read. Sukanta Chaudhuri explores, at a very fundamental level, how texts are constituted and how they work. He applies insights from many lines of study not brought together so closely before: theories of language, signification and reception alongside bibliography, textual criticism, editorial theory and book history. Blending case studies with general observation and theory, he considers the implications of the physical form of the text; the relation between oral and written language, and between language and other media; the new territory opened up by electronic texts; and special categories like play-books and translations. Drawing on an exceptionally wide range of material, both Western literature and Indian works from Sanskrit aesthetics to the poetry of Rabindranath Tagore, Chaudhuri sets a new agenda for the study of texts.
Graphics for Statistics and Data Analysis with R presents the basic principles of sound graphical design and applies these principles to engaging examples using the graphical functions available in R. It offers a wide array of graphical displays for the presentation of data, including modern tools for data visualization and representation.
The book considers graphical displays of a single discrete variable, a single continuous variable, and then two or more of each of these. It includes displays and the R code for producing the displays for the dot chart, bar chart, stemplot, boxplot, and variations on the quantile-quantile plot. The author discusses nonparametric and parametric density estimation, diagnostic plots for the simple linear regression model, polynomial regression, and locally weighted polynomial regression for producing a smooth curve through data on a scatterplot. The last chapter illustrates visualizing multivariate data with examples using Trellis graphics.
Showing how to use graphics to display or summarize data, this text provides best practice guidelines for producing and choosing among graphical displays. It also covers the most effective graphing functions in R.
Informazioni bibliografiche
- Titolo del Libro in lingua: Graphics for Statistics and Data Analysis with R
- Lingua: English
- Autore: Keen Kevin J.
- Editore: Chapman & Hall
- Data di Pubblicazione: 26 Aprile '10
- Genere: MATHEMATICS
- EAN-13: 9781584880875


